Kappa
“Great things are not done by impulse, but by a series of small things brought together.”
Hack The Box
Guided Lab: Traffic Analysis Workflow
One of our fellow admins noticed a weird connection from Bob's host IP = 172.16.10.90 when analyzing the baseline captures we have been gathering. He asked us to check it out and see what we think is happening.
Attempt to utilize the concepts from the Analysis Process sections to complete an analysis of the guided-analysis.zip provided in the optional resources and live traffic from the academy network. Once done, a guided answer key is included with the PCAP in the zip to check your work.
Task #1
Connect to the live host for capture.
Connection Instructions: Access to the lab environment to complete the following tasks will require the use of XfreeRDP to provide GUI access to the virtual machine so we can utilize Wireshark from within the environment.
We will be connecting to the Academy lab like normal utilizing your own VM with a HTB Academy VPN key or the Pwnbox built into the module section. You can start the FreeRDP client on the Pwnbox by typing the following into your shell once the target spawns:
xfreerdp /v:"target IP" /u:htb-student /p:HTB_@cademy_stdnt!
You can find the target IP, Username, and Password needed below:
- IP ==
- Username == htb-student
- Password == HTB_@cademy_stdnt!
Once connected, open Wireshark and begin capturing on interface ENS224.
Analysis
Follow this workflow template and examine the suspicious traffic. The goal is to determine what is happening with the host in question.
what is the issue?
- a brief summary of the issue.
define our scope and the goal (what are we looking for? which time period?)
- Scope: what are we looking for, where?
- when the issue started:
- supporting info: Files, data sources, anything helpful.
define our target(s) (net / host(s) / protocol)
- Target hosts: Network or address of hosts.
capture network traffic / read from previously captured PCAP.
- Perform actions as needed to analyze the traffic for signs of intrusion.
identification of required network traffic components (filtering)
- once we have our traffic, filter out any traffic not necessary for this investigation to include; any traffic that matches our common baseline, and keep anything relevant to the scope of the investigation.
An understanding of captured network traffic
- Once we have filtered out the noise, it's time to dig for our targets. Start broad and close the circle around our scope.
note taking / mind mapping of the found results.
- Annotating everything we do, see, or find throughout the investigation is crucial. Ensure you are taking ample notes, including:
- Timeframes we captured traffic during.
- Suspicious hosts/ports within the network.
- Conversations containing anything suspicious. ( to include timestamps, and packet numbers, files, etc.)
- summary of the analysis (what did we find?)
Finally, summarize what has been found, explaining the relevant details so that superiors can decide to quarantine the affected hosts or perform a more critical incident response mission. Our analysis will affect decisions made, so it is essential to be as clear and concise as possible.
Complete an attempt on your own first to examine and follow the workflow, then look below for a guided walkthrough of the lab.
This task was best completed using the PCAP file provided for the lesson. Following the steps in the workflow, we filled in the information and performed our analysis.
what is the issue?
- Suspicious traffic coming from within the network.
define our scope and the goal (what are we looking for? which time period?)
- target: traffic is originating from 10.129.43.4
- when: within the last 48 hours. Capture traffic to determine if it is still happening.
- supporting info: file: NTA-guided.pcap
define our target(s) (net / host(s) / protocol)
- scope: 10.129.43.4 and anyone with a connection to it. Unknown protocol over port 4444.
capture network traffic
- plug into a link with access to the 10.129.43.0/24 network to capture live traffic attempting to see if anything is happening.
- We have been given a PCAP with historical data that contains some of the suspect traffic. We will examine this to analyze the issue.
identification of required network traffic components (filtering)
- First, we will filter out anything that does not have a connection to 10.129.43.4, since this is our primary suspicious target for the moment.
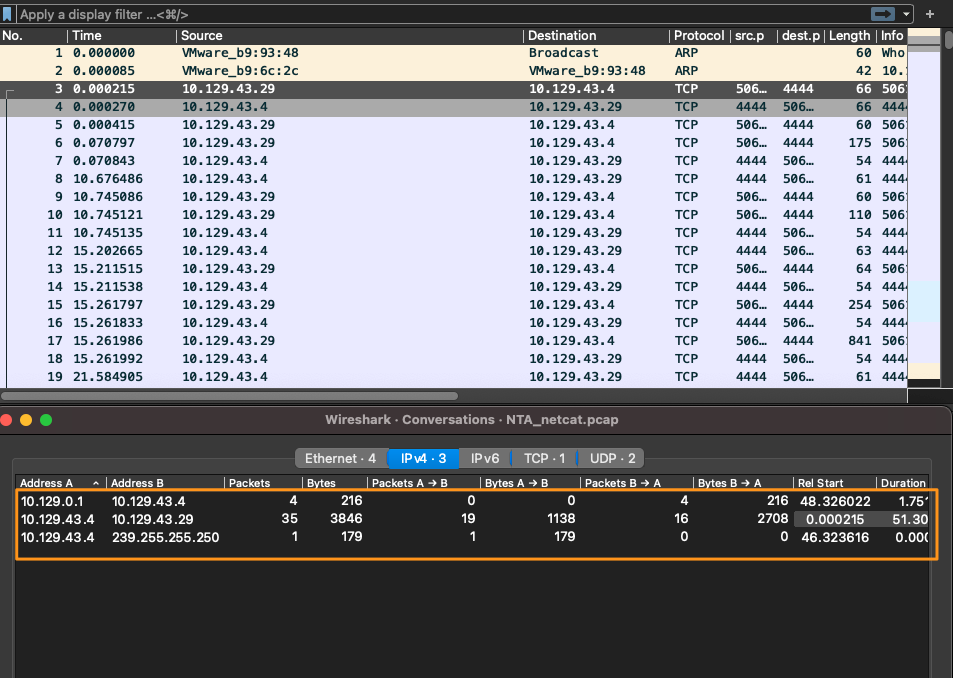
Conversations
After checking out the conversations plugin pictured, we can see there are only three conversations captured in this pcap file, and they all pertain to our suspicious host. Next, we will look at the protocol hierarchy plugin to see what our traffic is.
- https://academy.hackthebox.com/storage/modules/81/guided-conversations.png
- https://academy.hackthebox.com/storage/modules/81/guided-proto.png
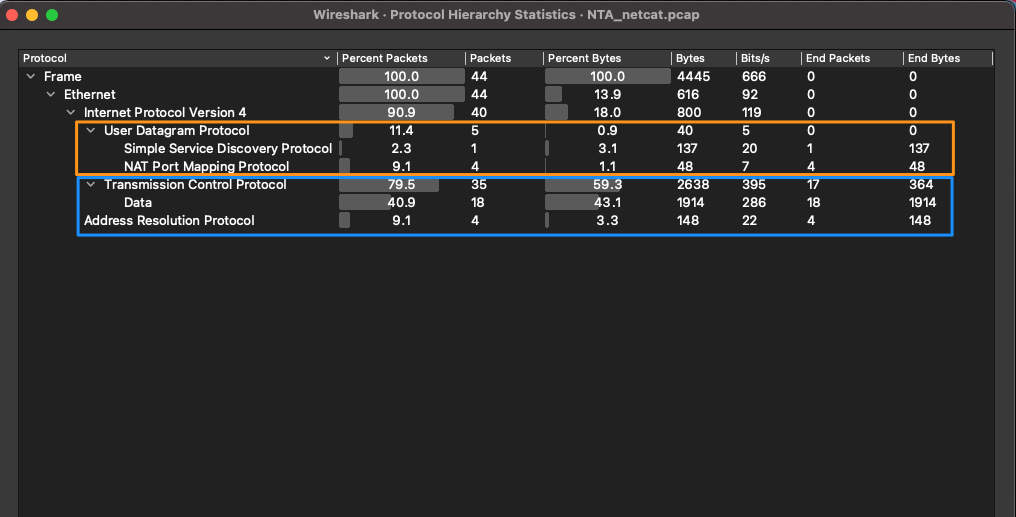
We can see here that this PCAP is mostly TCP traffic, with a bit of UDP traffic. Since there is less UDP than TCP traffic, let us look into that first.
Once we have filtered out the noise, it's time to dig for anything unusual. We are going to filter out everything but `UDP traffic first.
UDP
When filtering on just UDP traffic, we only see nine packets. Four arp packets, four Network Address Translation NAT, and one Simple Sevice Discovery Protocol SSDP packet. We can determine based on their packet types and information they contain that this traffic is normal network traffic and nothing to be concerned about.
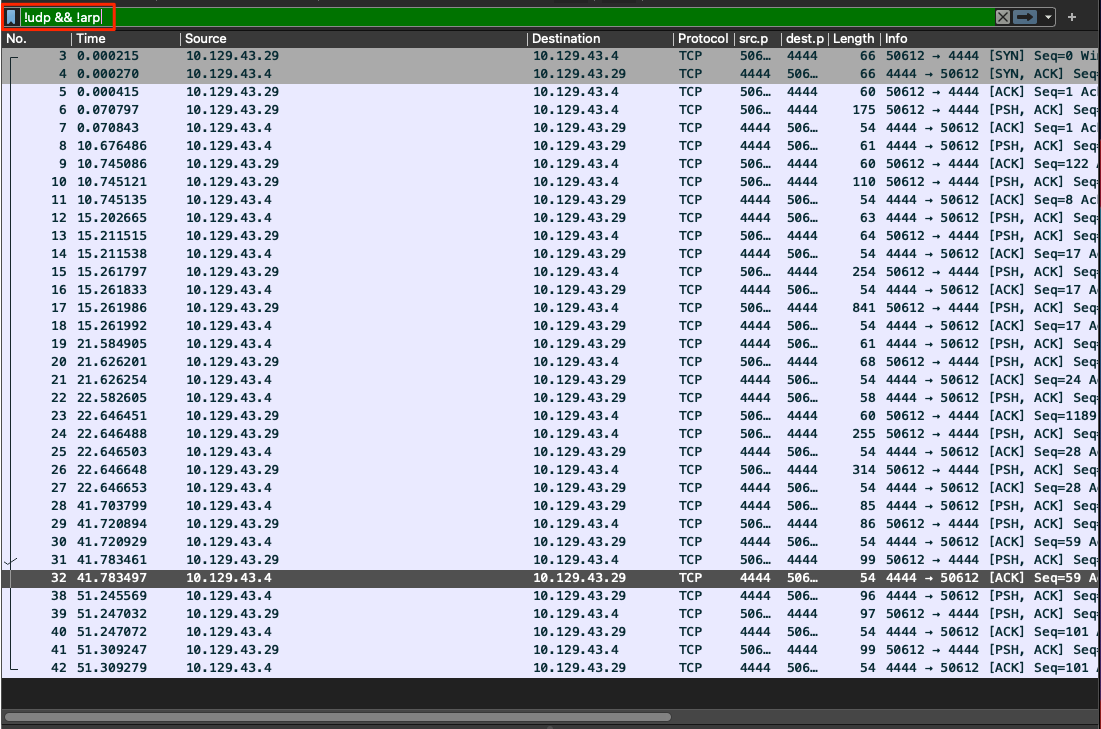
Now, let's move on to looking at TCP traffic. We should have quite a bit more here to sift through. We are going to utilize the display filter !udp && !arp. This filter will clear out anything we have already analyzed.
TCP
Now that we have cleared our view a bit, we can see the remaining packets are all TCP, and all appear to be the same conversation between hosts 10.129.43.4 and 10.129.43.29. We can determine this since we can see the session establishment via a three-way handshake at packet 3, and the same ports are used through the rest of the packets in the output below.
- https://academy.hackthebox.com/storage/modules/81/guided-tcp.png
- https://academy.hackthebox.com/storage/modules/81/guided-handshake.png
What does appear interesting is that we do not see a TCP session teardown in this PCAP file. This could mean the session was still active and not terminated. We believe this to be true since we do not see any Reset packets either. We can also examine the conversation by following the TCP stream from packet 3 to determine what it encompasses.
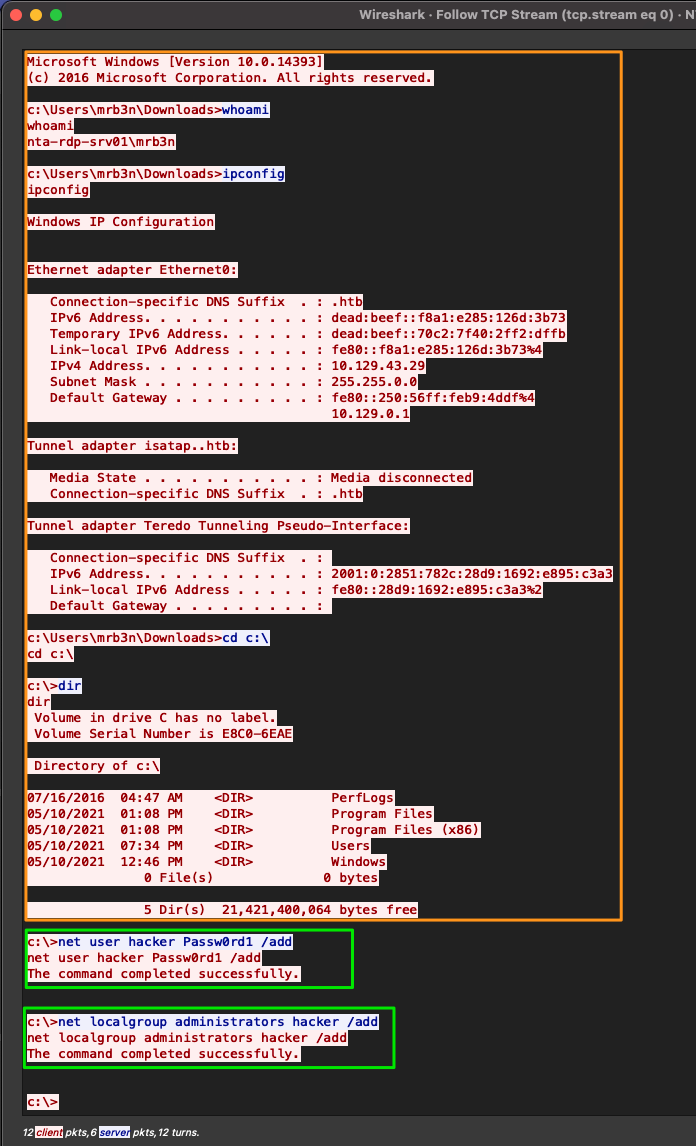
Follow TCP Stream
Now that we followed the TCP stream, we should have alarm bells ringing for us. We can see this entire conversation between the two hosts in plain text, and it appears that someone was performing several different actions on the host.
Looking at the image above, it appears that someone is performing basic recon of the host. They are issuing commands like whoami, ipconfig, dir. It would appear they are trying to get a lay of the land and figure out what user they landed as on the host. highlighted in orange in the image above.
What is truly alarming is that we can now see someone made the account hacker and assigned it to the administrators group on this host. Either this is a joke by a poor administrator. Or someone has infiltrated the corporate infrastructure.
note taking / mind mapping of the found results.
- Annotating everything we do, see, or find throughout the investigation is crucial. If needed, make a picture to depict the flow of actions.
- Using this example workflow, we have already documented our actions and have included screenshots of everything we included for analysis. These will help influence the decision made for a response.
summary of the analysis (what did we find?)
- Based on our analysis, we determined that a malicious actor has infiltrated at least one host on the network. Host 10.129.43.29 shows signs of someone executing commands to include user creation and assigning local administrator permissions via the net commands. It would look like the actor was using Bob's host to perform said actions. Since Bob was previously under investigation for the exfil of corporate secrets and disguising it as web traffic, I think it is safe to say the issue has spread further. The screenshots included with this document show the flow of traffic and commands utilized.
- It is our opinion that a complete Incident Response IR procedure be enacted to ensure the threat is stopped from spreading further. We can dedicate resources to clearing the malicious presence and cleaning the affected hosts.
Summary
After analyzing the actions taken, the IR team determined that The actor got lazy and decided to utilize a Netcat shell and directly interact with Bob's host while gathering more information. While doing so, he used RDP from Bob's host to another windows desktop in the environment to try and establish another foothold. Luckily, the IR team was able to capture some PCAP of the RDP traffic. Bob's host was quarantined, and incident response was initiated to determine what was taken and what other potential hosts were compromised. Great job spotting the intrusion.
Questions
RDP to with user "htb-student" and password "HTB_@cademy_stdnt!"
What was the name of the new user created on mrb3n's host?
How many total packets were there in the Guided-analysis PCAP?
What was the suspicious port that was being used?
Introduction to Network Traffic Analysis
- Network Traffic Analysis
- Networking Primer - Layers 1-4
- Networking Primer - Layers 5-7
- The Analysis Process
- Analysis in Practice
- Tcpdump Fundamentals
- Fundamentals Lab
- Tcpdump Packet Filtering
- Interrogating Network Traffic With Capture and Display Filters
- Analysis with Wireshark
- Familiarity With Wireshark
- Wireshark Advanced Usage
- Packet Inception, Dissecting Network Traffic With Wireshark
- ~ Guided Lab Traffic Analysis Workflow
- Decrypting RDP connections